


In Part One, I examined Steve Kirsch’s declaration that a Louisiana vaccine analysis was “game over” for the childhood vaccination schedule.
This second article goes deeper.
Nothing in this article should be interpreted as proof that childhood vaccines are safe or unsafe. The question here is narrower:
Do the Louisiana data support the specific causal conclusions Steve Kirsch draws from them?
Kirsch’s argument deserves to be evaluated on its strongest terms. He is not merely pointing to a loose correlation between statewide vaccination rates and infant mortality. He presents a particular analysis of Louisiana death and immunization records, argues that its odds ratios contradict vaccine safety, and claims that alternative explanations have effectively been eliminated.
Those are testable claims.
The most important question is not whether the results look unusual. It is whether the design can answer the question Kirsch says it answers.
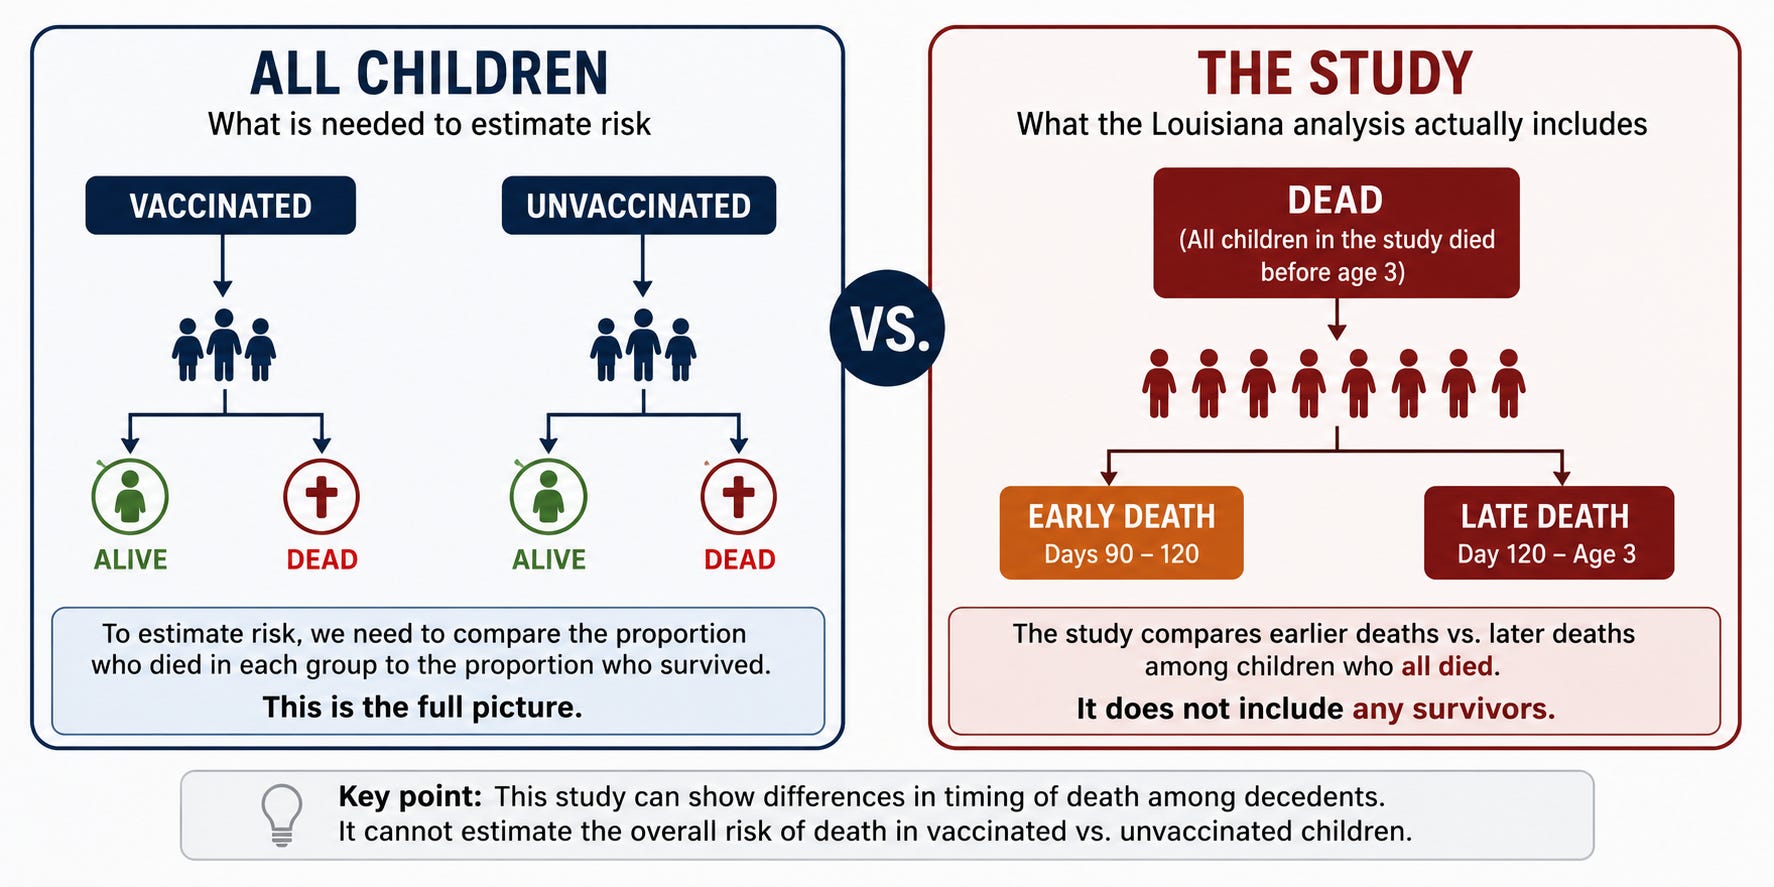
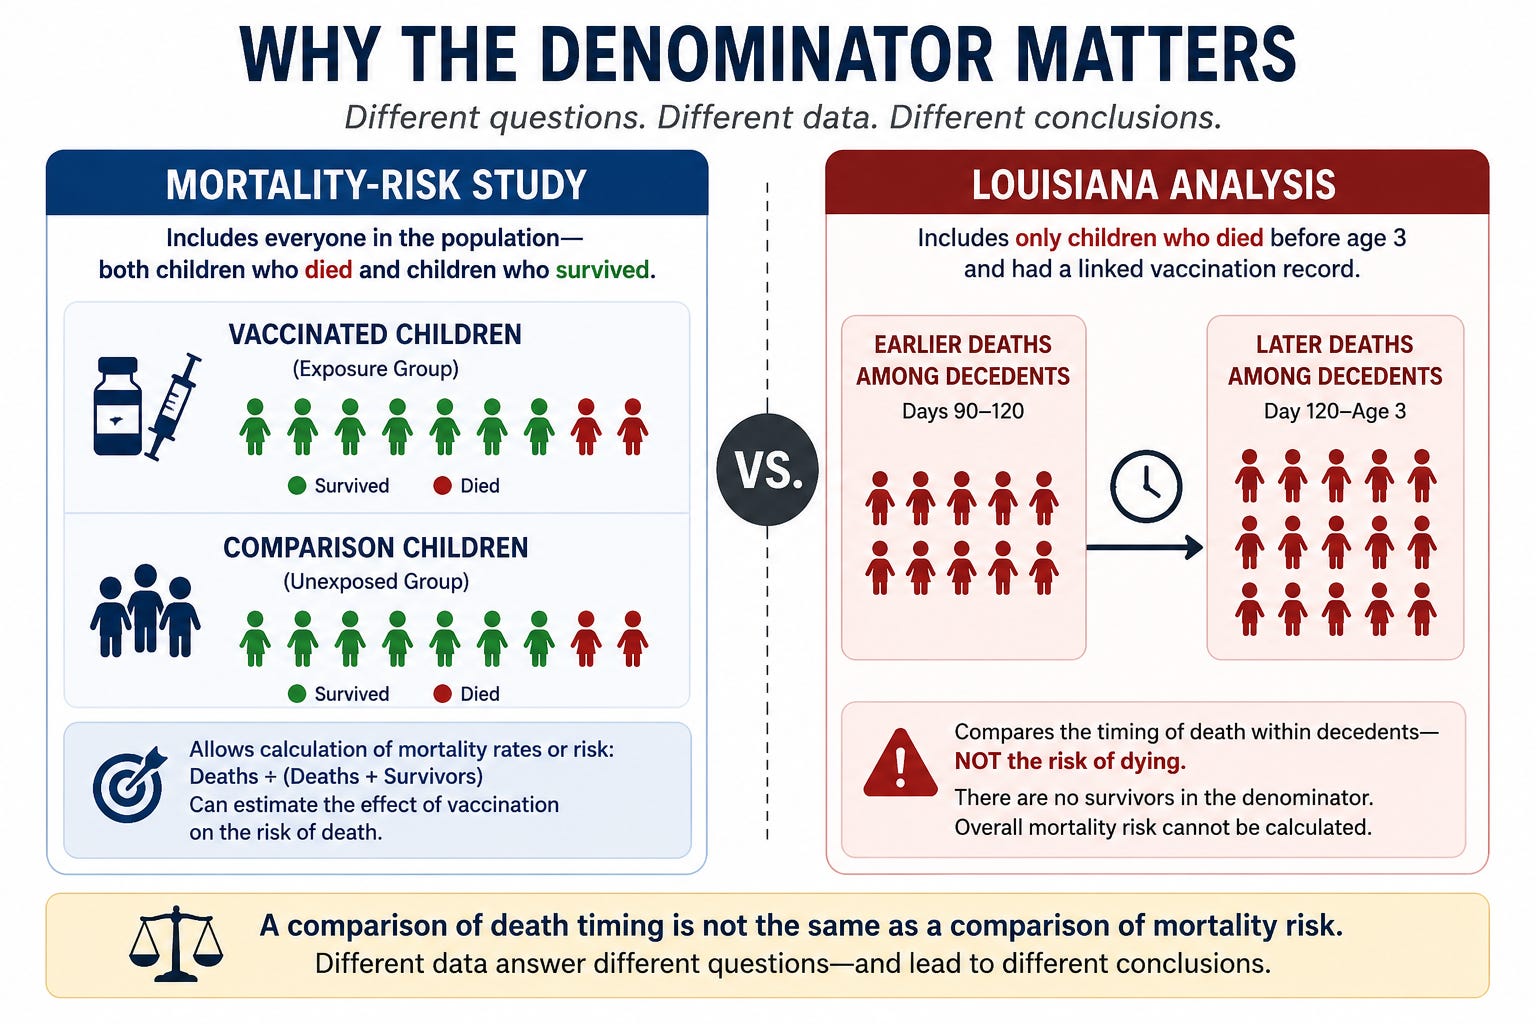
The distinction matters because the analysis includes only children who died. It does not compare mortality among vaccinated and unvaccinated populations.
Kirsch acknowledges this limitation in his own description:
“There are no survivors, so what follows is a comparison of death timing among decedents, not a risk.”
That sentence should guide the entire discussion.
What Kirsch claims
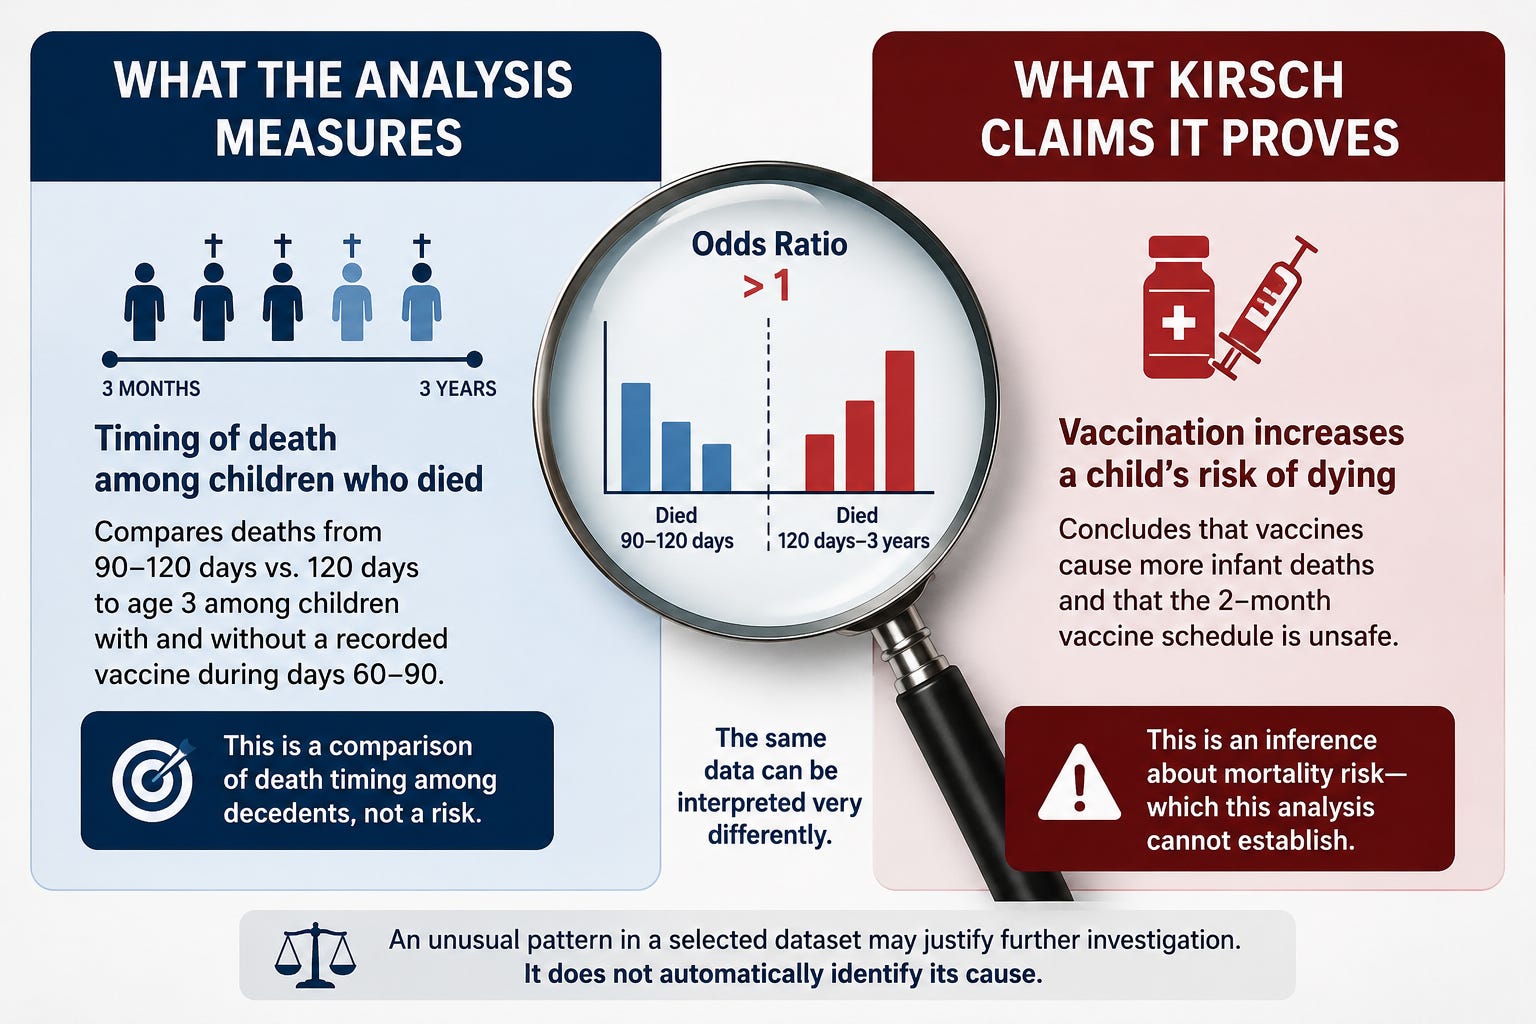
Kirsch writes that Brian Hooker’s analysis discovered that vaccination between two and three months of age “increases a child’s risk of dying.” He later concludes that the recommended vaccines for two-month-old children are unsafe.
What the analysis actually measures
According to Kirsch’s description, the study began with approximately 5,800 Louisiana children who died before their third birthdays.
Only 1,775 could be linked exactly to a record in the state immunization registry. After excluding 550 children who died before day 90, the analysis included 1,225 children, all of whom had died and all of whom had at least one documented immunization at some point.
Children were then classified according to whether a particular vaccine was documented between days 60 and 90.
The calculation compared:
deaths occurring from days 90 through 120; with
deaths occurring from day 120 through age three.
This can reveal whether the timing of death among selected decedents differed between the exposure categories.
This analysis, by itself, cannot estimate the overall mortality risk of vaccinated versus unvaccinated children because it contains no surviving comparison group.
To estimate mortality risk, researchers normally need an appropriate population at risk, including children who survived. Here, every participant reached the same outcome: death before age three.
Does the evidence support this conclusion?
Kirsch may accurately describe a difference in the distribution of death timing within this selected sample. But the broader statement that vaccination increased a child’s risk of dying does not follow from a dataset containing no surviving children.
The study’s own design cannot estimate the quantity Kirsch repeatedly claims it establishes.
A study can estimate only the quantity its design allows. If the design measures differences in death timing among decedents, it cannot directly estimate the probability that vaccination increased mortality in the broader child population.
Claim 2: The study compares vaccinated children with unvaccinated children
What Kirsch claims
Kirsch repeatedly refers to “vaccinated” and “unvaccinated” groups.
That language can easily give readers the impression that the analysis compares children who received vaccines with children who received none.
It does not.
What “unvaccinated” means in this analysis
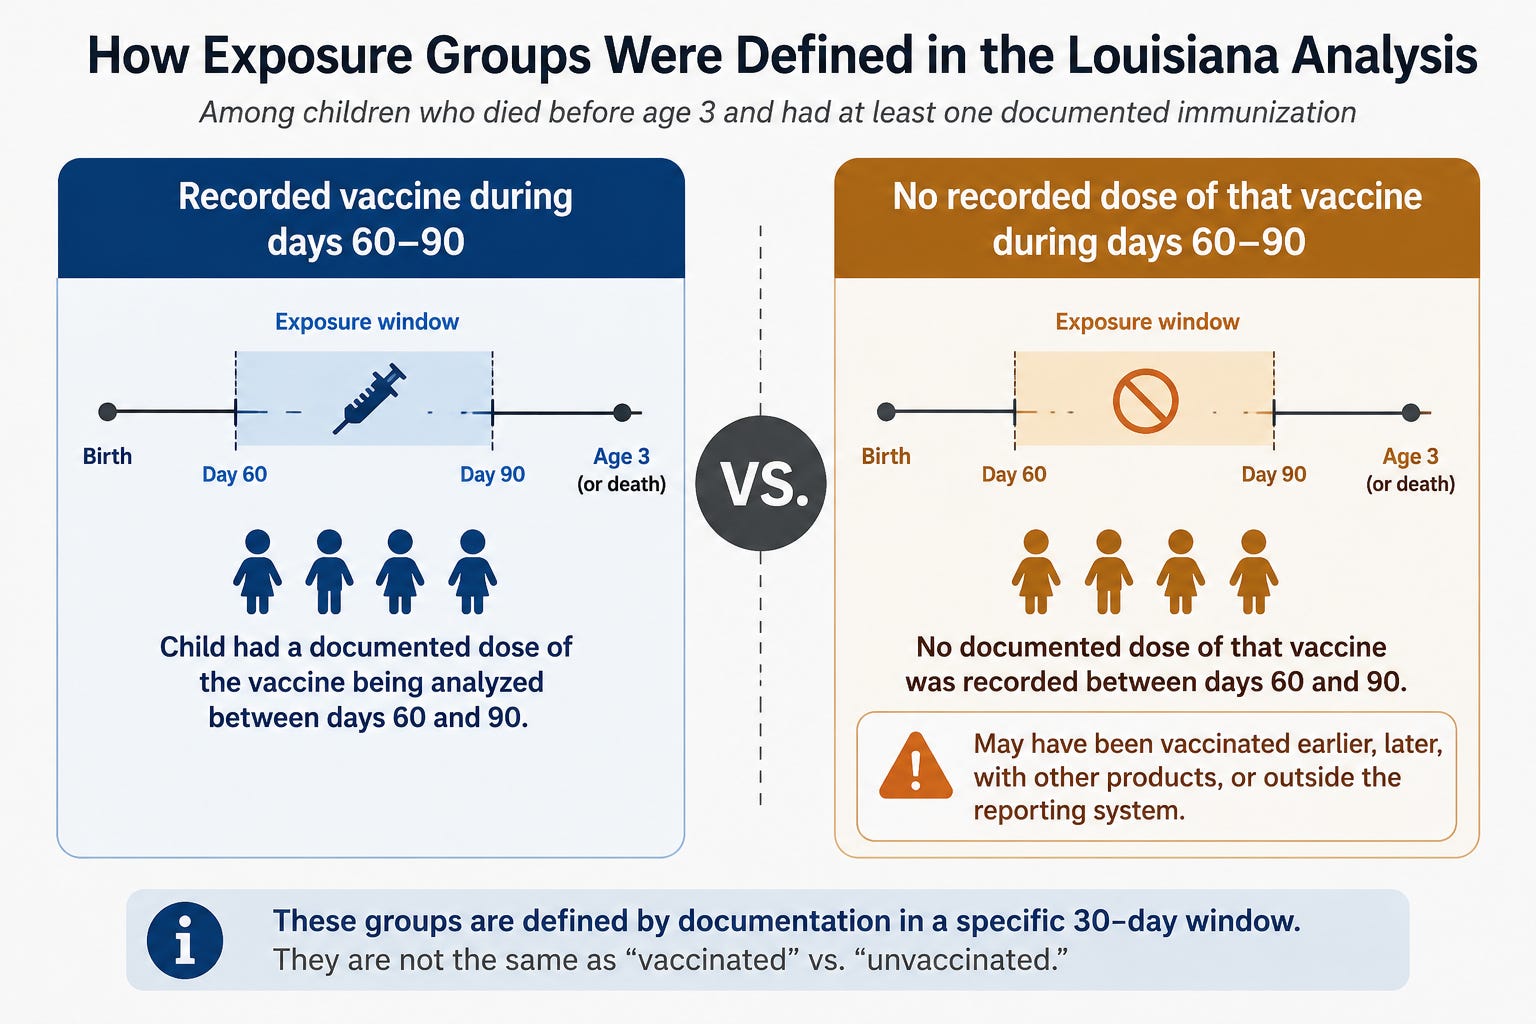
Kirsch explains that “vaccinated” means a child had a documented dose of the vaccine being analyzed between days 60 and 90.
“Unvaccinated” means there was no documented dose of that particular vaccine during that 30-day window. Children placed in this category may have received other vaccines, received the same vaccine later or had a dose that was not captured by the registry.
Kirsch explicitly states that “unvaccinated” does not mean never vaccinated.
This makes the label technically defined but potentially misleading outside the methods section.
A more accurate description would be:
vaccine documented during days 60–90, and
vaccine not documented during days 60–90.
That is a comparison of vaccination timing or recorded exposure status, not a conventional vaccinated-versus-unvaccinated comparison.
Why this matters
When readers hear that vaccinated children died sooner than unvaccinated children, they may reasonably interpret the statement as comparing fully vaccinated children with children who received no vaccines.
That is not what the data represent.
The second category may include children vaccinated on day 59, day 91 or later, children who received different products, and children whose immunization records were incomplete.
Verdict: Misleading without qualification
Kirsch eventually supplies the technical definition, but his repeated use of “unvaccinated” makes the findings sound broader than they are.
Claim 3: The odds ratio measures increased vaccine mortality
What Kirsch claims
Kirsch emphasizes that the odds ratio exceeded 1 in 54 of 55 subgroup analyses. He argues that, under a safe-vaccine hypothesis, the odds ratios should have been below 1.
What this odds ratio represents
The numerator and denominator are not deaths versus survival.
They are earlier deaths versus later deaths among children who all died.
In simplified form, the analysis calculates:
Odds of dying during days 90–120 rather than later, among selected decedents with a documented dose
divided by:
Odds of dying during days 90–120 rather than later, among selected decedents without a documented dose during the window
An odds ratio greater than 1 therefore, indicates that, within this selected sample, earlier death was relatively more common in one recorded-exposure category.
It is not an estimate of:
the odds that a vaccinated child will die;
the mortality rate among vaccinated children;
the relative risk of death compared with never-vaccinated children; or
the number of deaths caused by vaccination.
Kirsch moves between two different propositions:
Vaccinated decedents were distributed differently between the early- and late-death periods.
Vaccination increased mortality in the population.
The first may describe the calculation. The second requires a design capable of estimating population mortality risk.
Verdict: The odds ratios are being overinterpreted
The reported odds ratios may describe a pattern within the selected dataset. They do not directly measure vaccine-attributable mortality.
Claim 4: A safe vaccine should necessarily produce odds ratios below 1
What Kirsch claims
Kirsch argues that, under the hypothesis that the vaccines are safe, the odds ratios should have been below 1. He cites responses from several AI systems as support for that expectation.
Whether that expectation is correct depends on the study design, not on AI predictions. If a safe vaccine should necessarily produce odds ratios below 1, that expectation must be demonstrated from the statistical properties of the analysis itself.
Why that prediction is not established
Before interpreting an odds ratio as a test of vaccine safety, the expected value under the null must be derived from the actual sampling process and study design.
That process is complicated here because:
the sample contains only children who died;
inclusion required successful linkage to an immunization record;
exposure was defined by documentation during a narrow time window;
children without a dose during that period may have been vaccinated at other times;
vaccine availability and use changed during the 2013–2024 study period;
causes of death and underlying health conditions could affect vaccination timing;
every comparison reuses overlapping groups of children.
There is no general epidemiological rule stating that this particular decedent-only timing ratio must fall below 1 whenever a vaccine is safe.
AI systems cannot establish that rule merely by predicting it. Their responses depend on the assumptions included in the prompts, the information supplied and the models’ interpretation of an unusual design.
An AI response is not an independent replication, simulation study or mathematical validation.
Kirsch himself reports that Grok later reversed its position and said the direction could not reliably be predicted.
Verdict: Not demonstrated
Kirsch asserts the expected direction of the odds ratio but does not establish that expectation through a validated causal model, formal derivation or simulation reflecting the complete data-generating process.
Claim 5: Selecting only children who died does not invalidate the causal conclusion
What Kirsch claims
Kirsch argues that critics focus on irrelevant methodological objections instead of explaining the observed signal. He maintains that the simplicity of the calculation makes the findings especially difficult to attack.
The problem with selecting on the outcome
Restricting a study to people who experienced the outcome can produce associations that do not exist in the population from which they came.
This raises concerns about selection bias and, depending on the underlying causal structure, collider bias.
A collider is a variable influenced by two or more other factors. Conditioning on that variable, through restriction, stratification or participant selection, can create or distort an association between those factors. Epidemiologists therefore warn that selecting participants based on a common outcome can produce noncausal associations. (BMJ)
In this study, inclusion is conditional on death before age three and successful registry linkage.
That does not prove the reported association is entirely artificial. Nor does merely saying “collider bias” calculate its magnitude or direction.
But it does mean the selected association cannot automatically be treated as the causal effect of vaccination on mortality.
The design is appropriate for asking:
Among the linked children who died before age three, was recorded vaccination during days 60–90 associated with earlier rather than later death?
It is not sufficient for asking:
Did vaccination increase the risk that Louisiana children would die?
Those are different research questions.
Verdict: The design cannot support the population-level causal claim
The decedent-only restriction is not a minor wording problem. It determines what can and cannot be inferred from the results.
Claim 6: Fifty-four of 55 odds ratios above 1 cannot be explained by chance or bias
What Kirsch claims
Kirsch repeatedly emphasizes that 54 of 55 subgroup point estimates were above 1. He presents this consistency as evidence that the result is not random.
The pattern is certainly worth investigating.
But “54 of 55” does not necessarily mean 55 independent confirmations.
Why independence matters
The subgroup estimates appear to be derived from the same underlying dataset, using overlapping children, related vaccine categories, sex-specific subdivisions, and different combinations of exposure definitions.
When analyses reuse much of the same data, their results are correlated.
A systematic feature of the design, such as selection, record linkage, calendar time, exposure classification, or differences in the underlying health of children vaccinated on schedule, could affect many estimates in the same direction.
Therefore, counting the number of point estimates above 1 as though each were a separate experiment exaggerates the amount of independent evidence.
The article also emphasizes whether point estimates are above or below 1, but provides little discussion of confidence intervals, statistical precision, or the dependency among comparisons.
A point estimate above 1 is not automatically statistically distinguishable from 1.
If the same underlying bias affects every subgroup, it can move many estimates in the same direction simultaneously.
Verdict: Suggestive, but not 54 independent replications
The consistency deserves examination. It does not eliminate systematic bias, and the 55 comparisons should not be treated as 55 independent studies.
Claim 7: Differences among products and doses establish a biological dose-response relationship
What Kirsch claims
Kirsch describes differences by vaccine brand, antigen content, aluminum exposure and number of vaccines as a “perfect dose-response gradient.” He calls this the study’s “smoking gun.”
Why the pattern requires more analysis
A biological dose-response relationship can strengthen a causal argument. But first, the categories must provide a valid measure of increasing biological exposure while remaining comparable in other relevant respects.
Vaccine products are not randomly assigned across years, providers, or children.
Kirsch acknowledges that Vaxelis was introduced later in the study period and that this creates calendar-time bias. He argues that an AI-assisted correction was insufficient to remove the signal.
That acknowledgment matters.
A product introduced in 2021 cannot be compared with products used throughout 2013–2024 without carefully addressing:
changes in vaccine availability;
changing immunization practices;
changes in death-record linkage;
changes in infant healthcare;
the COVID-19 period;
differences in the ages and health profiles of recipients;
small subgroup sizes; and
reasons certain children received one product or combination rather than another.
Similarly, “number of vaccines” may reflect more than a biological dose. It may also reflect whether a child was healthy enough to attend a scheduled visit, whether records were complete, provider practices, and changes in combination products.
A gradient is therefore not self-interpreting.
Verdict: Potentially important, but not proof of causation
The product and dose patterns deserve transparent reanalysis. They cannot be declared biological dose-response effects without adequately addressing calendar time, product selection, health status, record completeness, and statistical uncertainty.
Claim 8: All Bradford Hill considerations are satisfied, proving causation
What Kirsch claims
Kirsch states that all Bradford Hill criteria are satisfied and concludes:
“This isn’t just correlation. This is CAUSATION.”
What Bradford Hill actually proposed
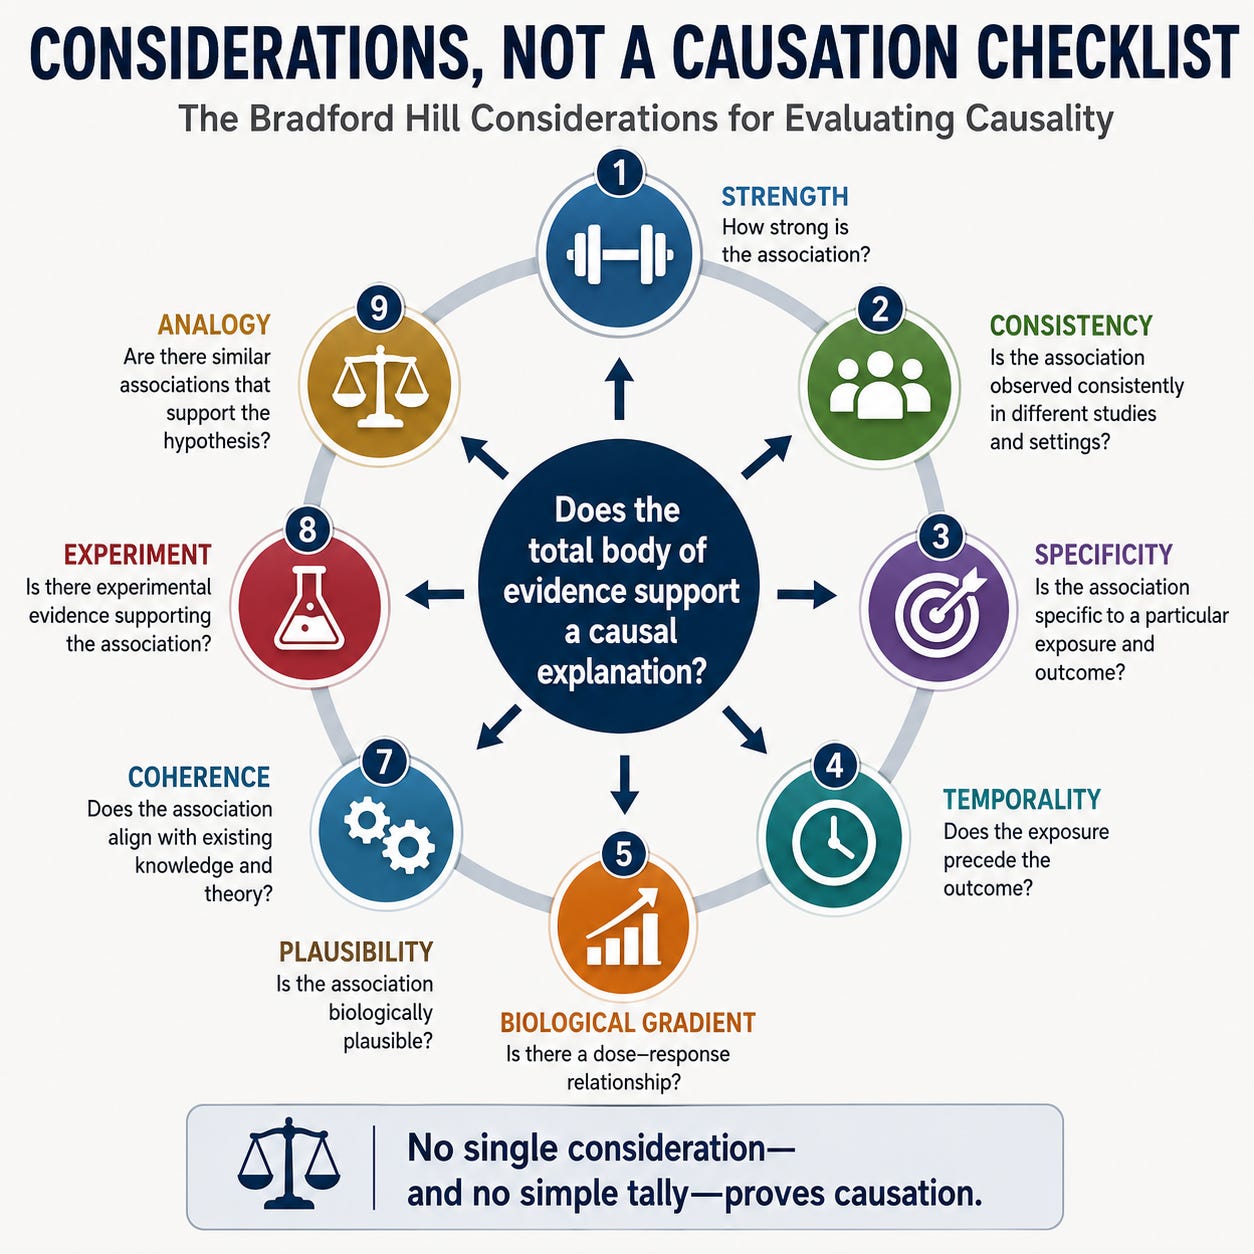
Austin Bradford Hill introduced nine considerations to help researchers think about when an observed association might be causal.
They were not intended as a mechanical checklist in which checking enough boxes converts an association into proof.
Hill explicitly cautioned that none of the considerations provides indisputable evidence for or against causation. His framework was intended to guide judgment across a body of evidence, not to repair a study design that cannot estimate the claimed effect. (PMC)
Several considerations are not clearly satisfied here:
Strength
Some reported point estimates may be elevated, but strength must be assessed alongside precision, valid comparison groups, and potential bias.
Consistency
Repeated analyses of overlapping groups within one dataset are not equivalent to consistent findings across independent populations and research teams.
Specificity
The analysis includes multiple vaccine products, combinations and causes of death. It does not establish a specific vaccine-to-specific-outcome pathway.
Temporality
Recorded vaccination preceded the early-death period, satisfying a necessary condition for causation. But temporality alone is not enough.
Biological gradient
Apparent product and dose patterns require control for calendar time, recipient differences, product selection, and record completeness before they can be interpreted biologically.
Plausibility and coherence
These require engagement with established biological and epidemiological evidence, not simply an assertion that aluminum or antigen counts create the expected ordering.
Experiment
The study is not an experiment, and the results have not been reproduced through a design that can estimate mortality risk.
Analogy
Analogy can suggest a hypothesis but is among the weakest grounds for establishing that a specific association is causal.
The available evidence does not justify claiming that all Bradford Hill considerations have been satisfied.
Bradford Hill’s considerations do not transform a decedent-only timing analysis into proof that vaccination increased population mortality.
Claim 9: Critics must provide a numerical confounder that completely reverses the results
What Kirsch claims
Kirsch demands that critics identify, “with NUMBERS,” the confounders that reverse the odds ratios and explain the product, dose, and sex patterns.
He portrays the refusal to do so as evidence that critics cannot explain the study.
Why this reverses the burden of proof
A critic does not have to reconstruct an unavailable dataset and identify one all-powerful confounder before pointing out that a design cannot estimate the claimed causal effect.
The primary questions are:
What quantity does the analysis estimate?
Is that quantity equivalent to mortality risk?
Are the exposure groups valid and comparable?
Can the selected data identify the causal effect?
Have plausible biases been measured and addressed?
Are uncertainty and alternative models reported?
If the study does not include survivors, no additional confounder is needed to demonstrate that it cannot directly calculate mortality risk.
Likewise, selection bias does not have to arise from one variable large enough to reverse every result. Several features of the sampling and classification process can operate together.
The burden rests with those making the causal claim to demonstrate that:
their design identifies the target effect;
their assumptions are justified;
relevant biases are controlled;
the results are robust; and
independent investigators can reproduce the analysis.
Kirsch argues that the vaccine is “the only remaining suspect.”
But a causal conclusion is not established by declaring that every unquantified alternative has been eliminated. The study must first be capable of distinguishing among those alternatives.
Verdict: The burden is misplaced
Critics should be specific whenever possible. But they are not required to produce a complete numerical countermodel from incomplete public information before identifying a fundamental mismatch between the study design and its conclusion.
What the Louisiana analysis may legitimately show
Rejecting Kirsch’s causal conclusion does not require pretending the observed pattern is meaningless.
Based on his description, the analysis may show that among Louisiana children who:
died before age three;
survived at least 90 days;
could be linked to an immunization-registry record; and
had at least one documented immunization,
The relative timing of death differed according to whether particular vaccines were documented during days 60–90.
That is a finding.
It may justify:
independent verification of the data extraction;
publication of complete cell counts;
confidence intervals for every estimate;
analysis by calendar year;
adjustment for age, health status, and cause of death;
investigation of linkage failures;
validation of vaccination records;
inclusion of the full birth cohort and surviving children;
Preregistered replication by independent researchers.
But it does not establish that vaccines increased infant mortality.
What a stronger study would require
A more informative analysis would begin with a defined cohort of Louisiana births and follow children over time.
Researchers would need:
complete or validated immunization histories;
children who survived as well as children who died;
person-time at risk;
clearly defined exposure categories;
adjustment for major differences affecting vaccination timing and mortality;
transparent treatment of missing and unmatched records;
calendar-time controls;
cause-specific and all-cause mortality analyses;
confidence intervals and sensitivity analyses;
preregistered methods; and
independent replication.
Depending on the question, researchers could use survival analysis, target-trial emulation, or another appropriate longitudinal design.
That would permit estimation of mortality rates or risks, something a decedent-only analysis cannot provide.
Conclusion
Kirsch is correct about one important point: unusual patterns in official data should not be dismissed merely because they challenge accepted views.
They should be investigated.
But investigation is not the same as declaring causation.
The Louisiana analysis does not compare mortality risk among vaccinated and unvaccinated children. It compares earlier and later death within a selected group in which every child died, and every included child had at least one documented immunization.
Its “unvaccinated” group is not a never-vaccinated group.
Its odds ratios do not estimate the odds that vaccination will cause death.
Its overlapping subgroup analyses are not 55 independent replications.
Its product patterns do not automatically establish a biological dose-response relationship.
And Bradford Hill’s considerations do not correct those limitations.
Kirsch repeatedly says there is “no credible way to attack this study.”
But the most important criticism is already contained in his own description of the data:
The analysis compares death timing among decedents, not mortality risk.
That is not hand-waving.
It is the difference between the question the study can examine and the conclusion Kirsch wants readers to accept. The results may justify a better study.
Good science welcomes challenging results.
Good science also requires that conclusions never outrun what the data can legitimately show.
That is the central issue in the Louisiana analysis.
Sources and further reading
Steve Kirsch, The Official Louisiana State Data Has No Other Explanation: US Childhood Vaccines Are Increasing Infant Mortality, July 17, 2026.
Jablonowski K, Hooker B. Increased Mortality Associated with 2-Month-Old Infant Vaccinations. The manuscript was posted on Preprints.org in December 2025 and withdrawn at the advisory board’s request in January 2026. (Preprints)
Hill AB. The Environment and Disease: Association or Causation? Proceedings of the Royal Society of Medicine. 1965. (PMC)
Cole SR et al. Illustrating Bias Due to Conditioning on a Collider. International Journal of Epidemiology. 2010. (PMC)
Hernán MA, Monge S. Selection Bias Due to Conditioning on a Collider. BMJ. 2023. (BMJ)
Holmberg MJ, Andersen LW. Collider Bias. JAMA. 2022. (JAMA Network)