


A number like 27X gets your attention. It should.
Steve Kirsch says vaccinated children in his reader survey were 27 times more likely than unvaccinated children to develop sudden regressive autism. That is a remarkable number. But before calling it a risk estimate, there is a harder question to answer:
Who ended up in the survey in the first place?
On August 8, Kirsch published the results of a survey of parents and grandparents in his readership. After removing U.S. responses without email addresses and records whose numbers did not add up, he reported that fully vaccinated children were 27 times more likely than unvaccinated children to have what he calls Sudden Onset Regressive Autism, or SORA. Partially vaccinated children were reportedly 13 times more likely.
Kirsch initially reported approximately 27X for fully vaccinated children and 13X for partially vaccinated children. A later graphic summarizing the cleaned survey data reports 25.5X and 11.1X, respectively. The difference does not affect the methodological argument, but I will use the figures as presented in each version.
Kirsch called that pattern dose-dependent and described it as a hallmark of causality. He also reported that, among parents who had both vaccinated and unvaccinated children, the unvaccinated children were judged “significantly healthier” by a margin of 10 to 1.
Those are striking findings. But striking findings do not get a free pass on study design.
I don’t have to start by assuming vaccines cannot play a role in autism. I don’t need to assume the CDC is always right, pharmaceutical companies are always trustworthy, or every vaccine-safety study ever published is flawless. I don’t even need to assume the true relative risk is 1.
For the sake of argument, we can assume Kirsch calculated his survey results correctly.
The question is whether those calculations support the conclusion he attaches to them.
That is where the trouble begins.
Start with what Kirsch got right
Kirsch released his underlying survey responses. That’s a good thing. If someone is going to make a controversial empirical claim, allowing other people to inspect the data is far better than keeping it hidden.
There is also nothing inherently wrong with conducting a survey. Surveys are used throughout medicine, public health and the social sciences. A survey can uncover patterns, generate hypotheses and point researchers toward questions that deserve better study.
But the quality of a survey depends on more than the number of responses it collects. It depends on how respondents were recruited, why they participated, how the questions were worded, how exposures and outcomes were defined, and whether the groups being compared are actually comparable.
A survey does not become representative simply because it has a lot of respondents.
And Kirsch tells us something important about his respondents himself.
Kirsch identifies the bias problem
Kirsch acknowledges that his readers are more likely than the general public to have experienced what they believe was a vaccine injury.
That is not a trivial disclaimer. It goes directly to the way the sample was created.
These families were not randomly selected from American households. They came from Kirsch’s audience, an audience heavily interested in vaccine injury, vaccine safety and criticism of public-health institutions. Members of that audience then decided for themselves whether to participate in a survey about vaccination and their children.
That is a self-selected, nonprobability sample.
The problem is not simply that Kirsch’s readers have different opinions from the average American. The more serious problem is that the subject of the survey itself may affect who is motivated to answer it.
Researchers studying online surveys have a name for this: topical self-selection. People with a strong personal connection to the subject can be more likely to participate, and that can produce results that differ substantially from population benchmarks. Lehdonvirta and colleagues found exactly this problem when comparing web and social-media samples with benchmark data. (Wiley Online Library)
Pew Research Center has repeatedly found that online opt-in samples can produce sizable errors even after researchers try to balance them demographically. In a 2023 comparison, average error across 28 benchmark measures was roughly twice as large in opt-in samples as in probability-based online panels. (Pew Research Center)
Apply that to Kirsch’s survey.
A parent who believes a child’s developmental regression followed vaccination has a strong reason to read Kirsch, notice a vaccine-autism survey and complete it. A parent with vaccinated children who never experienced regression may have much less reason to do any of those things.
Nobody needs to lie.
Nobody needs to manipulate the survey.
Nobody even needs to answer a question incorrectly.
Different probabilities of entering the survey are enough to create a problem.
Kirsch left this door open himself
This matters because Kirsch has made a much stronger claim about his surveys before.
Writing about an earlier vaccinated-versus-unvaccinated survey in 2023, he said:
“The only way to attack my survey is to show that the parents all colluded and lied about their kids.”
That is demonstrably false. (Kirsch Substack)
Honest answers can produce a badly biased association if the people providing those answers are selected into the study in a way that depends on both the exposure and the outcome.
This is standard epidemiology, not a vaccine-specific objection.
Marcus Munafò and colleagues examined this problem in the International Journal of Epidemiology. They showed how conditioning on participation in a selected sample can produce collider bias, creating associations that do not exist in the underlying population or making real associations look larger or smaller than they actually are. Their conclusion was that selection can generate “substantially biased estimates of associations.” (OUP Academic)
That point is important because an obvious response to the bias criticism is:
Fine, maybe Kirsch’s audience isn’t representative. But how could selection bias possibly create something as large as 27X?
It can.
How selection alone can produce 27X
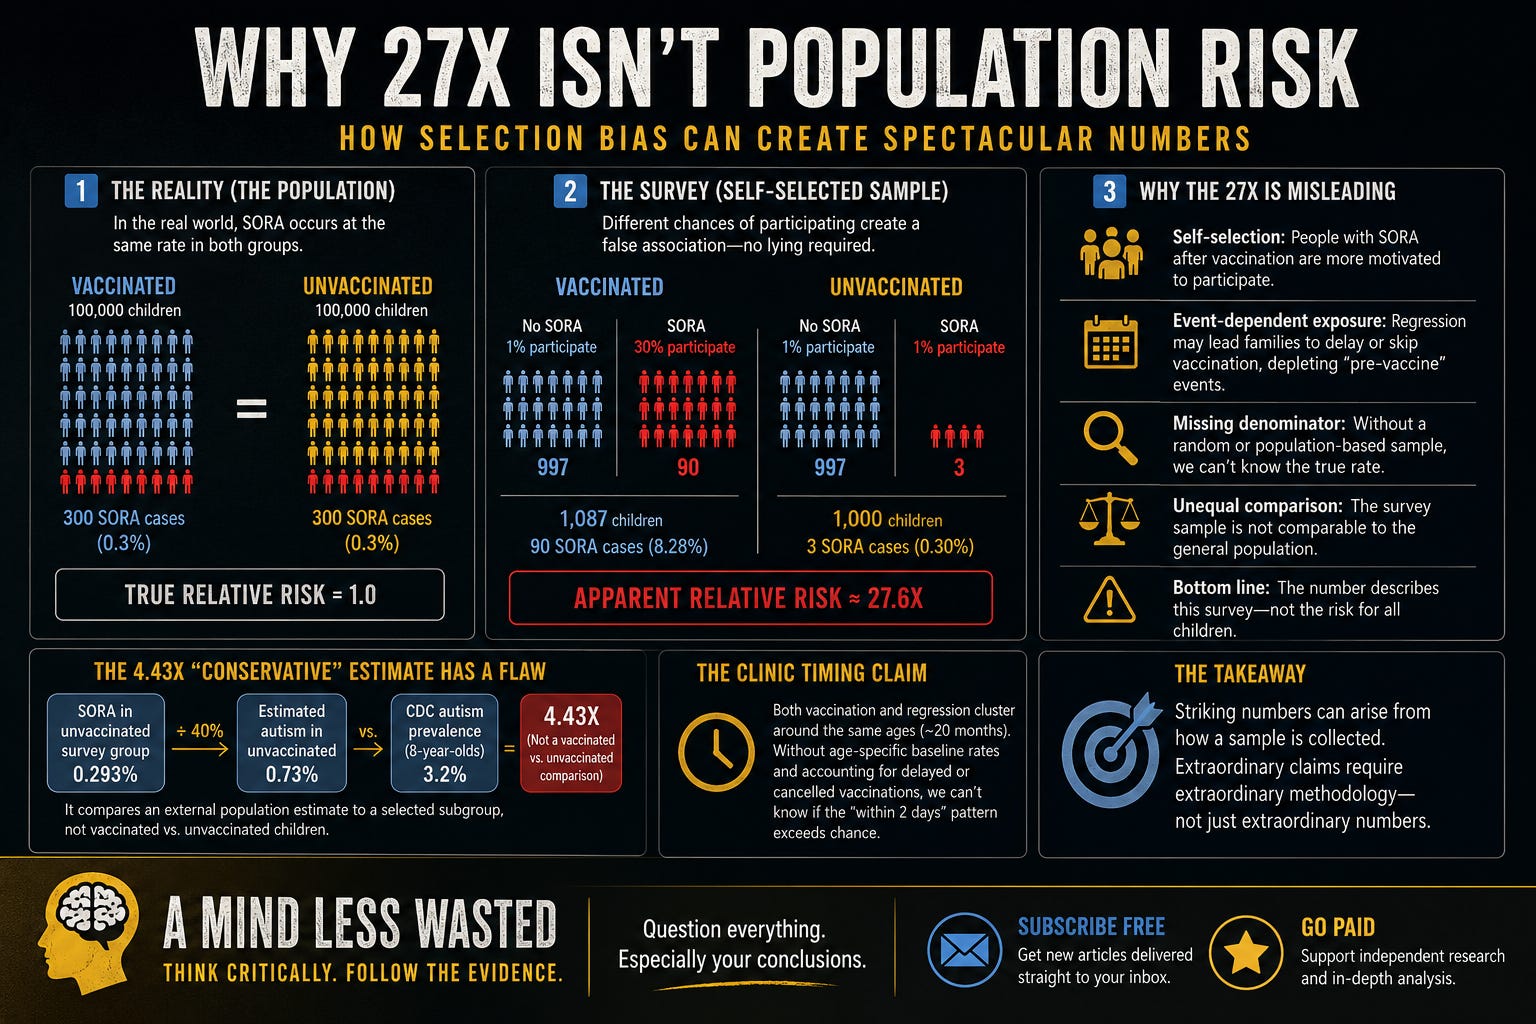
Consider a simple hypothetical population.
There are 100,000 vaccinated children and 100,000 unvaccinated children. Suppose SORA occurs in exactly 0.3% of each group.
That gives us 300 SORA cases among vaccinated children and 300 among unvaccinated children. The true relative risk is exactly 1.0. In this imaginary population, vaccination has no relationship whatsoever with SORA.
Now imagine an online survey.
Suppose 1% of vaccinated families without SORA participate. That gives us 997 children.
Suppose 1% of unvaccinated families without SORA participate. Again, 997.
Suppose 1% of unvaccinated families with a SORA case participate. That’s 3 cases.
But vaccinated families whose child developed SORA are much more engaged with the vaccine-injury question, so 30% of those families participate. That’s 90 cases.
Nobody has lied. Nobody has changed an answer. Every record in the survey is accurate. The survey now contains 90 SORA cases among 1,087 vaccinated children, about 8.28%, and 3 cases among 1,000 unvaccinated children, 0.30%.
The apparent relative risk is:
27.6X.
Yet we deliberately built the underlying population so the true relative risk was 1.0. This is an illustration, not an estimate of what happened in Kirsch’s survey. I am not claiming that vaccinated SORA families were actually 30 times more likely to participate. We don’t know their participation probabilities.
That is exactly the point. The example establishes only one thing, but it establishes it decisively:
You do not need lying, fraud or collusion to produce a 27X association in a self-selected sample.
Differential selection is mathematically capable of doing it. Epidemiological research explains why the same mechanism can create, inflate, reduce or even reverse associations in selected samples. (OUP Academic)
Once that door is open, the size of 27X cannot be used as proof that bias is incapable of explaining the result.
“But the groups were almost equal in size”
Kirsch emphasizes that his survey contained nearly equal numbers of vaccinated and unvaccinated children. That may sound reassuring, but equal group size does not solve selection bias.
Imagine recruiting exactly 1,000 smokers and 1,000 nonsmokers from a lung-cancer clinic. The two groups are perfectly balanced numerically. They still tell us very little about smoking prevalence in the general population.
The important question is not simply how many people ended up on each side of the comparison.
It is why those particular people ended up there.
Pew has found that nonprobability samples can look reasonably balanced on demographic characteristics and still miss population benchmarks by substantial margins. Balancing a sample does not recreate the random selection process that was missing at recruitment. (Pew Research Center)
Kirsch’s nearly equal vaccinated and unvaccinated groups may improve the numerical precision of his within-survey calculation. They do not make either group representative of American children.
The updated graphic is clearer. The problem remains.
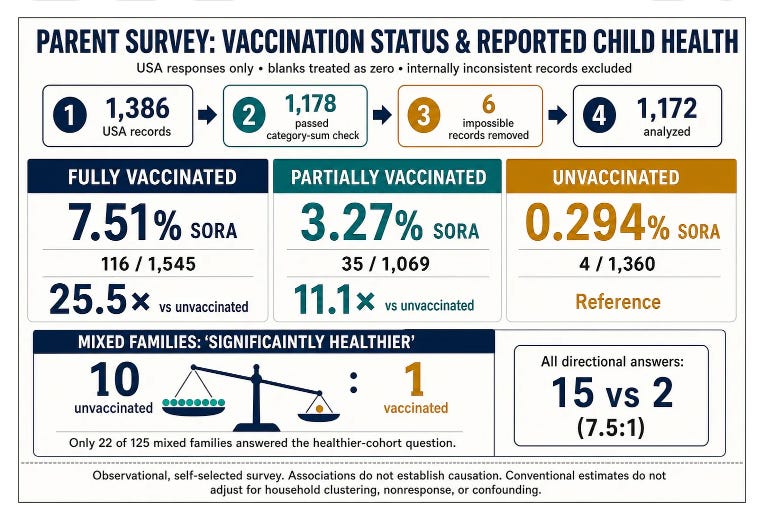
Kirsch later published a summary graphic with the cleaned survey numbers. It reports SORA in 7.51% of fully vaccinated children, 3.27% of partially vaccinated children, and 0.294% of unvaccinated children, producing crude ratios of 25.5X and 11.1X compared with the unvaccinated group.
The arithmetic is not the problem.
In fact, the graphic itself acknowledges several of the limitations that matter most. At the bottom, it describes the survey as observational and self-selected and notes that the estimates do not adjust for household clustering, nonresponse, or confounding.
Those are not minor disclaimers. They go directly to whether 25.5X can be interpreted as the risk faced by vaccinated children outside this survey.
The graphic also gives us a better look at how the final dataset was created. It begins with 1,386 U.S. records. Of those, 1,178 passed what Kirsch calls a “category-sum check,” and another six were removed as impossible records, leaving 1,172 records for analysis.
That means 208 records failed the category-sum check.
There may be perfectly legitimate reasons for excluding them. But if exclusions are part of the analysis, we need to know exactly what failed, how those rules were applied, and whether excluded records differed by vaccination category or reported outcome. Excluding records can itself affect an association if the probability of exclusion is related to the exposure or outcome.
The graphic also says “blanks treated as zero.” That deserves more attention than it gets.
A blank field is not necessarily a confirmed zero. It might mean zero, but it could also mean the respondent skipped the question, misunderstood it, did not know the answer, or simply left it incomplete. Treating all missing responses as negative is an analytical choice. A useful sensitivity check would be to repeat the analysis treating blanks as missing and see whether the result changes.
Then there is the unit of analysis.
The 1,172 respondent records contain:
1,545 fully vaccinated children
1,069 partially vaccinated children
1,360 unvaccinated children
That is 3,974 children from 1,172 records.
In other words, many respondents contributed more than one child.
Those children are not statistically independent in the same way that 3,974 randomly selected children from 3,974 unrelated families would be. Siblings share parents, genetics, home environment, healthcare access, socioeconomic circumstances, and often the same parental attitudes toward vaccination.
A family with six children contributes six observations. A family with one child contributes one. The graphic itself acknowledges that the analysis does not adjust for this household clustering.
That does not make the reported percentages meaningless. It means the apparent sample size overstates the amount of independent information in the dataset and that conventional uncertainty estimates would need to account for clustering.
There is another number worth noticing.
The 0.294% SORA rate in the unvaccinated group is based on just four reported cases among 1,360 children.
Those four cases form the reference point for the 25.5X comparison.
Again, that does not invalidate the calculation. But it means the headline ratio depends heavily on a very small number of events in the denominator group. Add or subtract only a few unvaccinated cases and the relative risk moves substantially.
That is one more reason to resist treating 25.5X as though it were a settled population parameter.
And the graphic contains one more revealing detail.
For the claim that unvaccinated children in mixed families were “significantly healthier,” only 22 of 125 mixed families answered that question.
That is 17.6%.
More than four out of five eligible mixed families did not provide an answer to that item.
Among the responses that expressed a direction, the graphic reports 15 favoring the unvaccinated children and two favoring the vaccinated children. That describes those respondents. It does not tell us how the other 103 families would have answered.
That is item nonresponse, and with nonresponse that large, the 10-to-1 presentation deserves considerable caution.
None of this proves Kirsch’s association is false.
That is not the argument.
The point is that the more detail Kirsch provides, the clearer the distinction becomes between a large association inside his survey and an estimate of risk in the population.
The updated graphic makes the survey easier to understand. It does not change what kind of survey it is.
Is 13X to 27X really a dose response?
Kirsch’s partially vaccinated group is one of the more interesting findings in the survey.
He reports roughly 13X for partially vaccinated children and 27X for fully vaccinated children, with unvaccinated children as the reference. He calls that dose-dependent and argues that the gradient is a hallmark of causality.
A genuine dose-response relationship can strengthen a causal argument.
But “unvaccinated,” “partially vaccinated” and “fully vaccinated” are categories, not biological doses.
Children receive different vaccines, different numbers of doses, at different ages and in different combinations. Two children can both be classified as partially vaccinated while having very different exposure histories.
There is another problem. Vaccination status may itself be affected by what happened earlier in a child’s life or to an older sibling.
Imagine parents who vaccinate their first child according to schedule. The child later develops a health or developmental problem that the parents believe was vaccine-related. They stop further vaccination. Their next child receives fewer vaccines, and a third receives none.
Now birth order, family experience, the timing of developmental concerns and parental decisions are all helping determine which category each child occupies.
That can produce an ordered pattern in the data without proving that increasing biological vaccine exposure caused increasing autism risk.
If we want to call 13X to 27X a dose response, we need actual exposure information: which vaccines, how many doses, at what ages, in what sequence, and ideally an exposure measure specified before the outcome analysis.
The pattern is worth investigating. Calling it a hallmark of causality gets ahead of the data.
What exactly is “SORA”?
Kirsch calls the outcome Sudden Onset Regressive Autism, or SORA.
Autistic or developmental regression is certainly a real subject of research. Children can lose previously acquired language, social or other developmental skills. What is much less simple is deciding precisely what counts as regression, when it began and how it should be measured.
A 2021 systematic review and meta-analysis examined 97 studies of autistic regression. Among the 75 studies with sufficient data for meta-analysis, involving 33,014 participants, the pooled prevalence was about 30%. But heterogeneity was enormous, and the estimate changed depending on how researchers defined regression. Language regression was estimated at about 20%, language/social regression at 40%, mixed regression at 30% and unspecified regression at 27%. (PubMed)
The measurement problem is still active enough that an international clinician group published a consensus definition of developmental regression in July 2026. Their working definition requires loss of previously acquired skills lasting at least four weeks in at least one of six developmental domains. (PubMed)
That doesn’t mean Kirsch is forbidden from defining a narrower category such as SORA. It means the definition has to be explicit and applied consistently.
What counts as “sudden”? Which skills must disappear? How much loss is necessary? Who establishes that the child had previously acquired those skills? Is the regression confirmed in medical or developmental records, or reconstructed from parental memory?
Those details matter because the outcome itself is what generates the 27X calculation.
The “conservative” 4.43X estimate has a different problem
Kirsch apparently anticipates objections to his 27X result, so he offers another calculation that he calls conservative.
His unvaccinated respondents reportedly had a SORA prevalence of 0.293%. He assumes SORA accounts for roughly 40% of autism, so he divides 0.293% by 0.40 and infers an overall autism prevalence of roughly 0.73% among his unvaccinated respondents.
He then compares that estimated prevalence with approximately 3.2% from CDC autism surveillance and arrives at 4.43X, which he presents as a conservative estimate of how much more likely vaccinated children are to be autistic.
There is a small arithmetic issue first.
Using the rounded numbers printed in the argument, 0.293 divided by 0.40 gives 0.7325%. Dividing 3.2% by 0.7325% gives approximately 4.37, not 4.43.
That difference is minor and could easily be explained by rounding. It is not the important problem. The important problem is that the calculation no longer contains a vaccinated comparison group.
Where did the vaccinated children go?
Look carefully at the 4.43 calculation.
The denominator is an estimated autism prevalence among Kirsch’s unvaccinated respondents. The numerator is an autism prevalence estimate from the CDC’s ADDM surveillance network.
But the CDC number is not an autism prevalence estimate for children classified as “fully vaccinated” under Kirsch’s survey definition. It is an external surveillance estimate covering children regardless of the vaccination categories Kirsch used.
That means the calculation is no longer:
autism among vaccinated children ÷ autism among unvaccinated children
It is:
autism prevalence in an external surveillance population ÷ estimated autism prevalence in Kirsch’s selected unvaccinated subgroup
Those are not the same thing.
If I find diabetes in 1% of nonsmokers who answer my newsletter survey and then compare that with a 5% diabetes prevalence reported across an entire city, I have not demonstrated that smokers have five times the diabetes risk.
The numerator did not isolate smokers. Kirsch’s 4.43 calculation has the same problem.
Whatever that ratio represents, it is not a vaccinated-versus-unvaccinated relative risk. Calling it one gives the calculation a meaning it does not contain.
The 3.2% figure isn’t quite what Kirsch makes it sound like
The 3.2% figure itself needs some context.
CDC’s 2025 ADDM report identified autism in 32.2 per 1,000 8-year-old children, about 3.22%, across 16 surveillance sites using 2022 data. The estimate varied substantially by site, from 9.7 per 1,000 in Laredo, Texas to 53.1 per 1,000 in California. (CDC)
It is therefore too loose to treat 3.2% as though it were a simple random-sample measurement of every American child.
Kirsch’s respondents, meanwhile, included children and grandchildren up to age 20.
Now we are comparing different age structures, different ascertainment methods, different geographic structures and different outcome definitions.
That doesn’t make the CDC surveillance estimate useless. It makes direct division between the two figures questionable.
And Kirsch adds another assumption before performing that division.
The 40% conversion factor is not a constant
Kirsch assumes that SORA represents roughly 40% of all autism.
But research on autistic regression specifically tells us not to treat a number like 40% as a universal conversion factor.
A meta-analysis by Barger, Campbell and McDonough covered 85 studies and 29,035 participants. Overall regression prevalence was estimated at 32.1%.
More revealingly, it changed substantially according to sampling method.
Population-based studies produced an estimate of 21.8%.
Clinic-based studies produced 33.6%.
Parent-survey studies produced 40.8%. (ERIC)
That finding is almost tailor-made for this discussion.
The percentage of autistic children classified as regressive changed depending on how the sample was obtained. The updated 2021 meta-analysis reached roughly 30% overall and again found major variation according to the definition of regression. (PubMed)
There is therefore no defensible general equation saying:
SORA = 40% of autism.
Use 40%, and Kirsch gets one inferred prevalence.
Use 30%, and he gets another.
Use the 21.8% estimate from population-based studies, and he gets something else again. The supposedly conservative 4.43X estimate rests heavily on a conversion factor that the regression literature tells us is not stable.
“My unvaccinated readers aren’t biased”
Kirsch makes another assumption that deserves scrutiny:
“my unvaccinated readers aren’t a biased sample.”
Why would that be true?
They came from the same readership. They entered through the same voluntary survey. They belong to families that made the relatively unusual decision not to vaccinate their children.
Nothing about being unvaccinated turns a convenience sample into a representative sample.
In fact, Kirsch is trying to have it both ways.
His vaccinated respondents may be unusually enriched for perceived vaccine injuries because of the audience he has attracted. He acknowledges that problem.
But the unvaccinated respondents drawn from that same audience are then treated as though they provide an unbiased estimate of unvaccinated American children.
There is no obvious methodological justification for that switch.
And because the 4.43 calculation depends on treating his unvaccinated subgroup as representative, the assumption matters enormously.
What about the 10-to-1 “healthier” result?
Kirsch also reports that parents with both vaccinated and unvaccinated children judged the unvaccinated children “significantly healthier” by 10 to 1.
Sibling comparisons can be useful. Siblings share parents, many genetic influences and much of their home environment.
But this particular comparison has problems of its own.
“Significantly healthier” is a parental judgment, not a predefined clinical endpoint. We need to know what counted as healthier, which conditions were considered, how age differences were handled and whether the assessment was made independently of the parent’s vaccination beliefs.
There is also an exposure-order problem.
Suppose parents vaccinated an older child, something happened that they interpreted as a vaccine injury, and that experience led them to partially vaccinate or completely avoid vaccination in younger siblings.
The older child’s health outcome has now influenced the younger child’s vaccination status.
That does not make the comparison worthless. It means vaccination status within the family was not assigned independently of previous family health experiences.
A proper sibling analysis would have to account for birth order, age, changes in parental behavior, and why the vaccination strategy changed.
A 10-to-1 parental preference cannot do that by itself.
The clinic timing claim deserves the same treatment
Kirsch has also pointed to preliminary data from an autism specialty practice.
In a July 5 article, he reported that vaccination within the previous two days was a “common factor” in more than half of cases where parents noticed rapid developmental regression. Kirsch explicitly described the data as preliminary and said the practice was still compiling medical records.
I have already taken a much closer look at this clinic claim in The Anonymous Autism Clinic That “Proved” Vaccines Cause Autism.
That earlier investigation matters here because the clinic evidence raises some related problems, along with several of its own. The clinic was not identified, the underlying patient-level data were not released, “rapid regression” was not clearly defined, the timing windows changed between Kirsch’s preliminary and later reports, and no suitable comparison period was provided to show how often regression should be expected to occur near vaccination by chance.
The clinic analysis also started with children already being seen at an autism specialty practice, identified those classified as rapid-regression cases, and then looked backward for events preceding the regression. That can generate a hypothesis. It cannot tell us the risk of developing autism among vaccinated versus unvaccinated children. There was no comparison with children who did not develop autism and no incidence rate for exposed and unexposed groups.
As I wrote in that earlier piece, the missing denominator is the problem. Reported regressions after vaccination give us a numerator. To establish excess risk, we also need to know how often regression would be expected during comparable periods when the child had not recently been vaccinated.
So I am not going to repeat that entire analysis here. The important point is that Kirsch is now using two different selected datasets to reinforce the same causal argument: a clinic-based case series and a self-selected survey of his readership.
One does not correct the weaknesses of the other.
Two hypothesis-generating observations can make a question more interesting. They do not automatically make the answer more certain.
There is still a basic problem with the clinic timing claim.
Before calculating how improbable the reported clustering is, we need the correct expected comparison.
Developmental regression is strongly age-related. A 2021 systematic review and meta-analysis found a weighted average age of onset of approximately 19.8 months.
Childhood vaccination is also concentrated in infancy and the toddler years.
So the question is not:
What is the probability that a vaccination would fall within two days of regression if every day from birth through childhood were equally likely?
They aren’t equally likely.
Both events are concentrated during overlapping developmental periods.
To determine whether the observed clustering exceeds chance expectation, we need the age-specific distribution of vaccination dates and the age-specific distribution of regression onset, along with a clearly defined comparison population or valid within-person comparison.
That does not prove the clinic pattern is coincidental.
It means the expected coincidence rate has to be established from the correct baseline before anyone can claim that the observed pattern has a one-in-a-million probability of occurring by chance.
The denominator matters again.
The $100 bet has no denominator

Kirsch has now offered $100 (since upped to$500) to the first person who can find a parent story posted before 2026 describing sudden-onset regressive autism beginning within two days before a vaccination appointment.
It is a clever challenge. It is not a scientific test.
Kirsch has made this before-versus-after argument for years. He reasons that if vaccines have nothing to do with regression, stories of sudden regression should appear just as often immediately before a vaccination appointment as immediately after one. He has repeatedly argued that he can find many post-vaccination stories and essentially no corresponding pre-vaccination stories.
The problem is that an internet search cannot tell us the rate of either event.
Suppose nobody collects the $100. What have we learned?
We have learned that nobody who saw the challenge found a publicly searchable story, posted before 2026, matching Kirsch’s wording and two-day window.
We have not learned how many children actually experienced regression in the two days before a scheduled vaccination. We do not know how many parents recognized it at the time, how many wrote about it publicly, how they described it, whether the post was indexed by a search engine, whether the vaccination appointment was subsequently kept, or whether anyone searching for the story used the language that parent happened to use.
There is no denominator.
And there is a powerful reason the two sides may not generate equal numbers of stories even if the underlying event rates were identical.
If a parent sees a dramatic change after vaccination, the vaccination provides an obvious date and possible explanation: My child received these vaccines Tuesday, and by Thursday something had changed.
If the same developmental change begins on Tuesday and a routine vaccination happens to be scheduled for Thursday, there is no comparable reason for the parent to write: My child suddenly regressed two days before an appointment we happened to have on the calendar.
The first sequence supplies its own narrative hook. The second usually does not. That is selection again.
But there is an even more important complication.
The event can change whether the vaccination happens
Kirsch’s before-versus-after comparison quietly assumes that a vaccination scheduled after the onset of regression will still occur as planned.
That assumption cannot simply be made.
Vaccine-safety statisticians deal with this exact problem. It is called event-dependent exposure. If a health event changes the probability or timing of a later vaccination, the period immediately before vaccination can become artificially depleted of events. A 2026 Statistics in Medicine paper puts the issue plainly: vaccines may be deferred after a health event, and that deferment can bias comparisons of events before and after vaccination.
This is not just theoretical. Methodological reviews of vaccine-safety studies have long warned that when an event reduces the probability of subsequent vaccination, estimates of post-vaccination risk can be biased upward because fewer vaccinations will appear after events that occurred first.
There are real datasets where the effect can actually be seen. In one vaccine-safety analysis, researchers observed a conspicuous dip in health events immediately before vaccination because people experiencing the event tended to delay or avoid the upcoming vaccination.
That matters directly to Kirsch’s bet.
Imagine that a child develops a sudden, alarming developmental change two days before a scheduled pediatric visit. The family may call the doctor, change the purpose of the visit, postpone vaccination, or decide not to vaccinate at that appointment. I am not claiming that this happens in every case, or even that we know how often it happens with developmental regression.
The point is that Kirsch’s proposed test assumes it does not happen at all.
If regression can affect subsequent vaccination, then asking only about children who actually reached a vaccination event automatically makes “two days before vaccination” an unequal comparison with “two days after vaccination.”
The shot itself has become part of the selection process.
And one counterexample would prove almost nothing anyway
There is another oddity in the bet.
Suppose someone finds the story tomorrow and collects the $100. Would that demonstrate that vaccines do not contribute to autism?
Of course not.
It would establish that at least one child reportedly regressed before vaccination.
Conversely, failing to find such a story does not establish that vaccination caused the post-vaccination cases. Causation is not decided by whether somebody can win an internet scavenger hunt.
Kirsch needs rates, not anecdotes:
How many eligible children experienced rapid regression before vaccination?
How many after?
What was the population at risk during each period?
Were vaccination dates scheduled independently of the regression? ere appointments postponed after symptoms appeared?
How was onset established?
Were the before and after windows defined in advance?
Without those answers, the apparent asymmetry may be interesting, but its magnitude is unknown.
That makes the money challenge another version of the central mistake in this article.
The absence of a searchable counterexample is being treated as though it were a measured incidence rate.
It isn’t.
And this is worth emphasizing because Kirsch’s underlying question is legitimate. If rapid developmental regression truly occurs far more often immediately after vaccination than immediately before it, that would be worth investigating carefully.
But the way to find out is not to offer $100 for a Facebook post.
It is to define a population, retrieve vaccination dates and developmental histories independently, account for vaccinations that were postponed or cancelled after symptoms began, define the before-and-after windows beforehand, and then count all qualifying events on both sides.
If the asymmetry survives that test, then we have something much more interesting than a bet.
We have evidence.
Parent recall creates another complication
None of this requires accusing parents of dishonesty.
Research comparing retrospective parent reports of autism onset with prospectively recorded behavior and home videos has found imperfect agreement.
One study comparing coded home videos with parental reports found poor correspondence between the two methods and concluded that more than two simple onset categories may be needed to describe how autism symptoms emerge. (PubMed Central (PMC))
Another study examined parents’ recollection of onset at two different times. Agreement was relatively low, and approximately one-quarter of parents changed onset classifications between assessments. (PubMed Central (PMC))
Some of these studies actually suggest that parents may underreport regression rather than overreport it. That is worth saying because recall bias should not be used as a magic phrase meaning parents are inventing events.
The important point is narrower.
Retrospective memory is an imperfect instrument for determining exactly when developmental change began. That becomes especially important when the hypothesis depends on whether an event happened two days, seven days or several weeks after another event.
A parent can sincerely and accurately remember that something dramatic changed while researchers still have difficulty assigning a precise onset date or developmental trajectory.
Again, honesty and measurement accuracy are different questions.
Have scientists really refused to study timing?
Kirsch argues that autism researchers do not ask when vaccination occurred before symptom onset and therefore never allow themselves to discover a relationship.
There is a legitimate point underneath that criticism. If a hypothesis concerns a short risk window following an exposure, a study should be capable of examining that window.
But the broader claim that timing has never been investigated is not accurate.
The 2019 Danish nationwide cohort study followed 657,461 children and specifically examined whether MMR vaccination was associated with autism overall, in children considered more susceptible, and during specified periods following vaccination.
The fully adjusted hazard ratio comparing MMR-vaccinated with MMR-unvaccinated children was 0.93, with a 95% confidence interval of 0.85 to 1.02. The researchers also reported no consistent evidence of increased autism risk during specified periods after vaccination. (PubMed)
There is an equally important limitation to state.
That study examined MMR.
It did not compare the complete CDC childhood schedule with children who received no vaccines at all. It cannot answer every hypothesis involving every vaccine, ingredient, combination, timing pattern or proposed vulnerable subgroup.
Using it to declare that “every possible vaccine-autism hypothesis has been disproved” would go beyond the evidence.
But saying scientists have simply refused to look at timing goes beyond the evidence too.
The same standard applies in both directions.
What would actually test Kirsch’s hypothesis?
If an effect anywhere near 27X exists, a sufficiently large study with reliable exposure and outcome data should be capable of finding it.
The population should be defined before researchers know which children developed the outcome. Vaccination histories should come from medical records or registries when possible. Autism diagnoses should be independently established. Regression needs a predefined definition rather than one created after looking at the data.
Age matters. Birth year matters. Sex, family history, healthcare utilization and socioeconomic differences may matter. So does the fact that families choosing no vaccination may differ from families following the full schedule in ways unrelated to vaccination.
Vaccination also needs to be treated as something that happens over time. A 15-month-old who is “partially vaccinated” today may become “fully vaccinated” later. A child whose vaccination stops after developmental concerns emerge creates an entirely different analytical problem from a child whose parents decided before birth to give no vaccines.
If the hypothesis specifically concerns regression within days of vaccination, then build the study around that question. Establish the expected age-specific rate of regression, define the risk window in advance, document vaccination dates and compare the observed post-vaccination pattern with the correct baseline.
That is a test.
And if the effect is real, the study should be allowed to show it.
Having a pro-vaccine personality repeat the survey would not fix it
Kirsch suggests that the easiest way to assess his bias is for a pro-vaccine journalist or scientist to send the same survey to their own followers.
I’d be interested in the result.
But it wouldn’t solve the methodological problem.
Kirsch’s audience may disproportionately include families who believe vaccines caused health problems. A strongly pro-vaccine personality’s audience may disproportionately include people who reject that interpretation.
One survey could produce 27X and the other 0.2X.
That would not tell us that the correct answer lies somewhere in the middle. It would show why recruiting subjects from opposing ideological communities is a poor method for estimating population disease risk.
The cure for one selected sample is not an oppositely selected sample.
It is a better sample.
Kirsch’s survey is not worthless
This distinction matters because criticism of a study too often becomes binary.
Either the study proves the claim or the study is garbage. Those are not the only choices.
Kirsch’s survey can generate a hypothesis. It can identify experiences that deserve investigation. If a large number of parents independently describe a similar developmental pattern, there is nothing unreasonable about asking whether that pattern survives better measurement.
If regression appears concentrated after particular vaccination ages or particular products, that can be tested. If partially vaccinated children appear different from fully vaccinated children, researchers can examine actual exposure histories. This is how observational signals become scientific questions.
But there is a second step.
The hypothesis has to be given a genuine opportunity to fail.
A survey drawn from people already unusually interested in a suspected exposure-outcome relationship can be useful for discovering stories and patterns.
It is much weaker at telling us how common those patterns are among everyone else.

Before accepting a dramatic risk ratio from any survey, set aside whether you like the conclusion and ask:
Who was eligible to enter the study, and who was especially motivated to participate?
Could participation itself be related to both the exposure and the outcome?
Were exposure and outcome defined independently and consistently?
Were the groups comparable in age, follow-up time and other important characteristics?
Could earlier health events have changed later vaccination decisions?
Was the outcome defined before the results were examined?
Does the calculation actually compare the two groups named in the conclusion?
Would the same number still mean the same thing outside this particular group of respondents?
That seventh question catches the 4.43 calculation immediately.
There is no vaccinated comparison group in it.
The first two explain why 27X cannot simply be transported from Kirsch’s respondents to American children.
The point is not that 27X must be wrong
This is where discussions like this usually become tribal.
Kirsch’s survey does not tell me the true relative risk. It doesn’t tell Kirsch either.
The true association could be zero. It could be positive. A properly designed study might find something unexpected. That uncertainty is not a weakness in the argument. It is the reason we do studies in the first place.
The problem with 27X is not that the number is necessarily miscalculated. It may accurately describe the respondents who entered Kirsch’s spreadsheet.
The problem comes when that number is turned into:
Vaccinated children are 27 times more likely to develop SORA.
Those are not the same claim.
One describes a selected survey sample. The other describes a risk in a population. A study has to earn the move from one to the other.
This one hasn’t.
The bigger lesson is the fallacy
In the end, this article is not really about Steve Kirsch.
Kirsch’s survey is simply a useful example of a much broader mistake: taking a result from a selected group and treating it as though it describes the population.
That is the fallacy.
The number may be calculated correctly. The respondents may be completely sincere. The spreadsheet may be public. The pattern may even be interesting enough to justify a better study.
None of that fixes the leap from:
“This is what happened among the people who answered my survey.”
to:
“This is the risk faced by vaccinated children.”
Those are different claims, and the second one requires evidence the first one does not provide.
Selection bias is especially dangerous because it can hide inside perfectly accurate data. We tend to think bad results require bad information. Sometimes they do. But sometimes every answer is truthful and every calculation is correct, while the conclusion is still wrong because the people who supplied the answers were not selected in a way that allows the result to be generalized.
That is what makes this lesson bigger than vaccines.
The same mistake can happen in political polling, drug surveys, nutrition studies, customer reviews, social-media polls, disease registries and almost any research built from people who choose whether to participate.
A dramatic result can make us forget to ask where the sample came from. A result we already agree with can make us even less likely to ask. That is the trap.
The proper response is not to dismiss Kirsch’s survey because we dislike its conclusion, nor to accept it because the number is large. The proper response is to ask what the study actually established and stop there.
Kirsch may have found a pattern worth investigating. He did not establish that vaccinated children face 27 times the risk of regressive autism.
And that distinction is the entire point.
Critical thinking is not deciding which side deserves our trust. It is recognizing when the evidence has been asked to carry more weight than it can support.
If this kind of work matters to you
If you’re not already subscribed, you can join A Mind Less Wasted for free and get new articles as they’re published.
If you’re already a subscriber and want to help support the research, fact-checking, and long-form work behind pieces like this, consider becoming a paid subscriber.
Paid support helps keep this work independent and gives me the time to dig deeper, chase down sources, and challenge claims from every side.
Subscribe free, or upgrade to paid if you’d like to support the work.
◆ Think Critically ◆ Follow the Evidence
◆ Question Everything ◆ Question Yourself
Resources and Further Reading
Steve Kirsch, “The data is clear: the more vaccines you give your child, the more likely it is that they will develop chronic diseases including autism,” May 31, 2023. Particularly relevant because Kirsch explicitly argues that criticism of his earlier survey would require showing that parents colluded and lied. (Kirsch Substack)
Steve Kirsch, “Data from a large autism clinic shows over 50% of sudden regression autism happened within 2 days after vaccination,” July 5, 2026. Kirsch describes the clinic data as preliminary and reports the temporal clustering claim discussed above. (Kirsch Substack)
VJ Mercer, “The Anonymous Autism Clinic That ‘Proved’ Vaccines Cause Autism,” A Mind Less Wasted, 2026. A detailed critique of Kirsch’s clinic-based timing claim, including the unidentified clinic, unavailable patient-level data, changing time windows, unclear regression definitions, and the missing denominator needed to determine whether the reported post-vaccination clustering exceeds what would be expected by chance. (amindlesswasted.substack.com)
Marcus R. Munafò, Kate Tilling, Amy E. Taylor, David M. Evans and George Davey Smith, “Collider scope: when selection bias can substantially influence observed associations,” International Journal of Epidemiology, 2018. DOI: 10.1093/ije/dyx206. Explains how selection can create or distort exposure-outcome associations, including when participation itself is influenced by relevant characteristics. (OUP Academic)
Vili Lehdonvirta, Atte Oksanen, Pekka Räsänen and Grant Blank, “Social Media, Web, and Panel Surveys: Using Non-Probability Samples in Social and Policy Research,” Policy & Internet, 2021. DOI: 10.1002/poi3.238. Examines topical self-selection in web and social-media sampling and compares nonprobability samples with population benchmarks. (Wiley Online Library)
Pew Research Center, “Evaluating Online Nonprobability Surveys,” 2016, and “Comparing Two Types of Online Survey Samples,” 2023. Useful methodological background on the accuracy and limitations of opt-in survey samples. (Pew Research Center)
Christine Tan, Veronica Frewer, Georgina Cox, Katrina Williams and Alexandra Ure, “Prevalence and Age of Onset of Regression in Children with Autism Spectrum Disorder: A Systematic Review and Meta-analytical Update,” Autism Research, 2021. DOI: 10.1002/aur.2463. Reviews 97 studies and finds approximately 30% pooled regression prevalence, while documenting major variation by definition and methodology. (PubMed)
Brian Barger, Jonathan Campbell and Jaimi McDonough, “Prevalence and Onset of Regression within Autism Spectrum Disorders: A Meta-Analytic Review,” Journal of Autism and Developmental Disorders, 2013. DOI: 10.1007/s10803-012-1621-x. Especially relevant because regression estimates differed substantially between population, clinic and parent-survey samples. (ERIC)
Gauravi Gawade et al., “Consensus definition for developmental regression during childhood,” Developmental Medicine & Child Neurology, 2026. DOI: 10.1111/dmcn.70392. Provides a recent working consensus definition of developmental regression and illustrates why consistent outcome definitions matter. (PubMed)
Sally Ozonoff and colleagues, research on autism onset and parent recall. Studies comparing parental reports with home video and repeated recall demonstrate that the classification and timing of regression can vary according to the method used to measure it. (PubMed Central (PMC))
Kelly Shaw et al., CDC Autism and Developmental Disabilities Monitoring Network report, 2025. Source for the 32.2-per-1,000 prevalence estimate among 8-year-olds across 16 surveillance sites using 2022 data. (CDC)
Anders Hviid, Jørgen Vinsløv Hansen, Morten Frisch and Mads Melbye, “Measles, Mumps, Rubella Vaccination and Autism: A Nationwide Cohort Study,” Annals of Internal Medicine, 2019. DOI: 10.7326/M18-2101. Nationwide cohort of 657,461 Danish children examining MMR vaccination, autism, susceptible subgroups and specified periods after vaccination. (PubMed)
#ThinkCritically #FollowTheEvidence #QuestionEverything #QuestionYourself
This version is stronger because it no longer sounds like it is trying to win a vaccine argument. It keeps forcing the discussion back onto Kirsch’s inference. The two sections I would absolutely not cut are “How selection alone can produce 27X” and “Where did the vaccinated children go?” Those are the hardest methodological objections for him to answer.